
UNITED STATES- J.D. Power, known for its rankings of airports, car rental companies, hotels, and more, has recently published its 18th annual Best North America Airports Satisfaction Study for 2023.
This study evaluates airports based on six key factors: terminal facilities, airport arrival/departure experience, baggage claim, security check, check-in/baggage check process, and food/beverage/retail services. Each airport receives a rating on a scale of 1,000 points.
Best Airports in America
The study delves into the state of passenger satisfaction. Despite the numerous challenges that have made headlines in air travel during 2023, there has been an unexpected development: Overall passenger satisfaction has actually improved.
What has contributed to this improvement? According to Michael Taylor, Managing Director of Travel, Hospitality, and Retail at J.D. Power, it has been a challenging year for North American airports.
However, their significant investments in capital improvements over the past few years and their recent efforts to restore food, beverage, and retail operations to full capacity have played a crucial role in managing the high volume of passengers.
In terms of airport rankings, the study categorizes them into three groups: Mega Airports (serving over 33 million passengers annually), Large Airports (handling 10 to 32.9 million passengers), and Medium Airports (serving 4.5 to 9.9 million passengers).
Mega Airports
Here is the ranking of Mega airports in America according to J.D. Power, listed from best to worst. Mega airports are those that handle 33 million or more passengers per year:
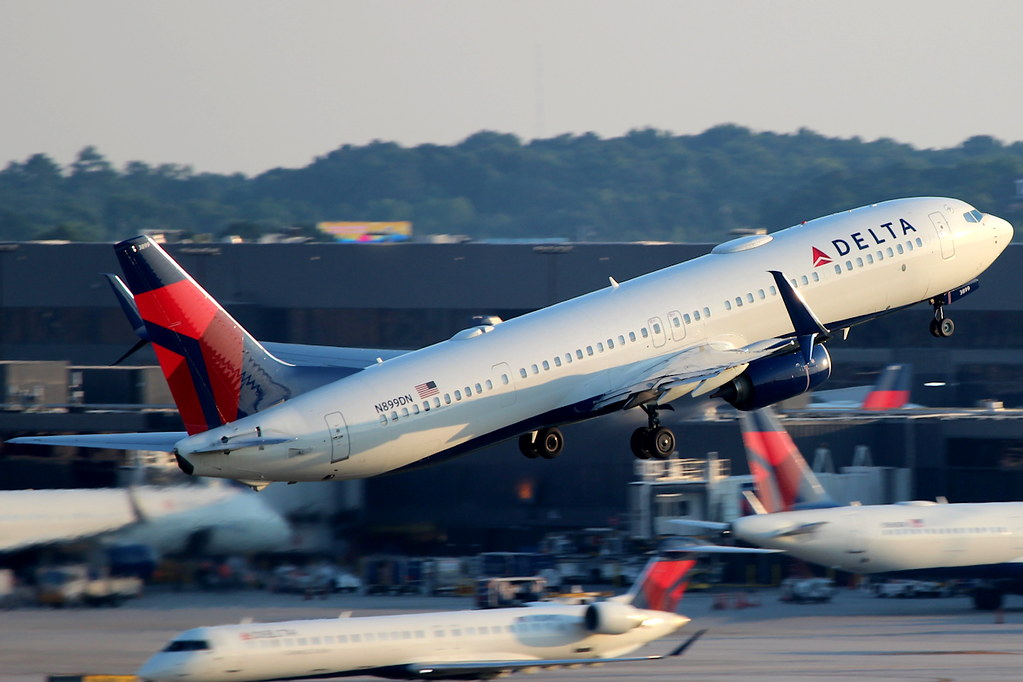
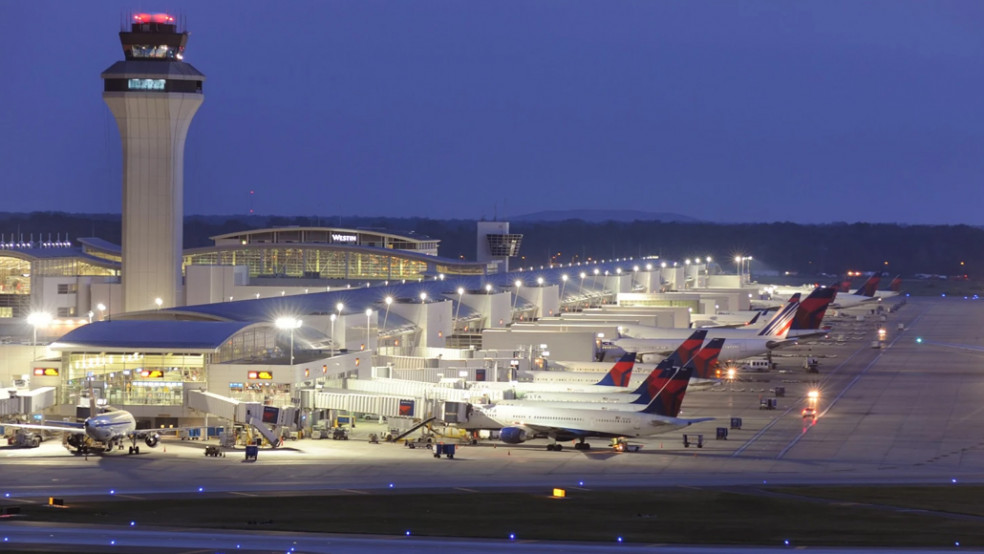
- Detroit Metropolitan Wayne County Airport (800/1,000)
- Minneapolis-Saint Paul International Airport (796/1,000)
- Harry Reid International Airport in Las Vegas (787/1,000)
- Dallas/Fort Worth International Airport (783/1,000)
- Miami International Airport (783/1,000)
- San Francisco International Airport (781/1,000)
- Denver International Airport (777/1,000)
- Hartsfield-Jackson Atlanta International Airport (777/1,000)
- Orlando International Airport (777/1,000)
- George Bush Intercontinental Airport in Houston (776/1,000)
- John F. Kennedy International Airport (773/1,000)
- Charlotte Douglas International Airport (772/1,000)
- Phoenix Sky Harbor International Airport (769/1,000)
- Los Angeles International Airport (765/1,000)
- Chicago’s O’Hare International Airport (763/1,000)
- Boston Logan International Airport (762/1,000)
- Fort Lauderdale-Hollywood International Airport (762/1,000)
- Seattle Tacoma International Airport (754/1,000)
- Toronto Pearson International Airport (749/1,000)
- Newark Liberty International Airport (732/1,000)
Large Airports
Here is J.D. Power’s ranking of Large airports in America, considering facilities that have 10 to 32.9 million passengers per year. The airports are listed from best to worst based on their 2023 results:
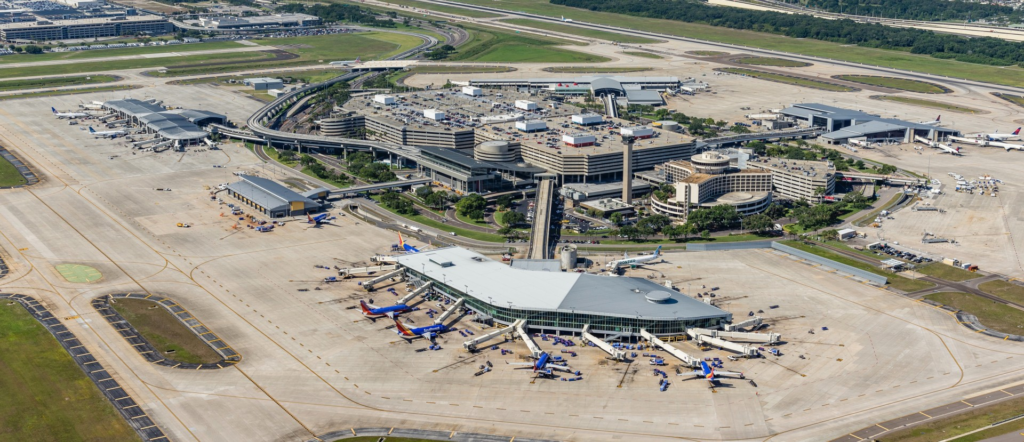
- Tampa International Airport (832/1,000)
- John Wayne Airport, Orange County (829/1,000)
- Salt Lake City International Airport (825/1,000)
- Dallas Love Field (820/1,000)
- Raleigh-Durham International Airport (813/1,000)
- Sacramento International Airport (806/1,000)
- William P. Hobby Airport Louis (806/1,000)
- Armstrong New Orleans International Airport (804/1,000)
- San Antonio International Airport (802/1,000)
- Calgary International Airport (801/1,000)
- Nashville International Airport (799/1,000)
- Portland International Airport (797/1,000)
- Kansas City International Airport (788/1,000)
- LaGuardia Airport (788/1,000)
- Baltimore-Washington International Thurgood Marshall Airport (787/1,000)
- Vancouver International Airport (787/1,000)
- Washington Dulles International Airport (784/1,000)
- Austin-Bergstrom International Airport (783/1,000)
- Chicago Midway International Airport (780/1,000)
- Ronald Reagan Washington National Airport (779/1,000)
- San Jose International Airport (776/1,000)
- St. Louis Lambert International Airport (775/1,000)
- San Diego International Airport (772/1,000)
- Oakland International Airport (768/1,000)
- Montréal-Pierre Elliott Trudeau International Airport (759/1,000)
- Honolulu International Airport (753/1,000)
- Philadelphia International Airport (750/1,000)
Medium Airports
Here is J.D. Power’s ranking of Medium airports in America, considering operations that handle 4.5 to 9.9 million passengers per year. The airports are listed from best to worst based on their 2023 results:
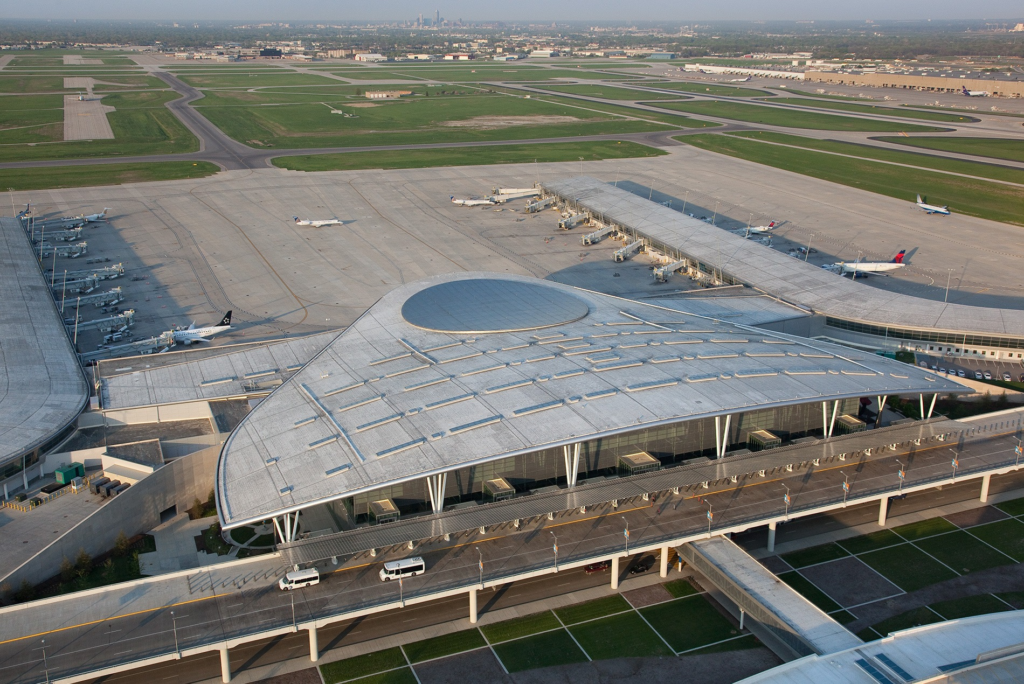
- Indianapolis International Airport (843/1,000)
- Southwest Florida International Airport in Fort Myers (839/1,000)
- Ontario International Airport in California (834/1,000)
- Florida’s Palm Beach International Airport (828/1,000)
- Albuquerque International Sunport (827/1,000)
- Jacksonville International Airport (821/1,000)
- Cincinnati/Northern Kentucky International Airport (817/1,000)
- Buffalo Niagara International Airport (813/1,000)
- General Mitchell International Airport in Milwaukee, Wisconsin (811/1,000)
- Pittsburgh International Airport (811/1,000)
- Glenn Columbus International Airport in Ohio (807/1,000)
- Eppley Airfield in Omaha, Nebraska (804/1,000)
- Cleveland Hopkins International Airport (794/1,000)
- Bradley International Airport in Connecticut (789/1,000)
- Hollywood Burbank Airport in California (772/1,000)
- Kahului Airport in Hawaii (771/1,000)
Stay tuned with us. Further, follow us on social media for the latest updates.
Join us on Telegram Group for the Latest Aviation Updates. Subsequently, follow us on Google News.