
If you’re planning a trip abroad for the 2025 holiday season — or flying home from one — your choice of arrival airport may end up shaping your experience more than you expect.
International travel demand has cooled from the post-pandemic wave of 2023, but terminals across the U.S. will still feel busy this December.
And while you might assume a dip in demand means shorter lines, the reality is more nuanced: staffing levels shift, forecasts change, and even a modest spike in arrivals can create unexpected bottlenecks.
Before you finalize your itinerary, here’s a closer look at what the data shows about holiday-season immigration and customs wait times, along with practical ways to move through the process faster.
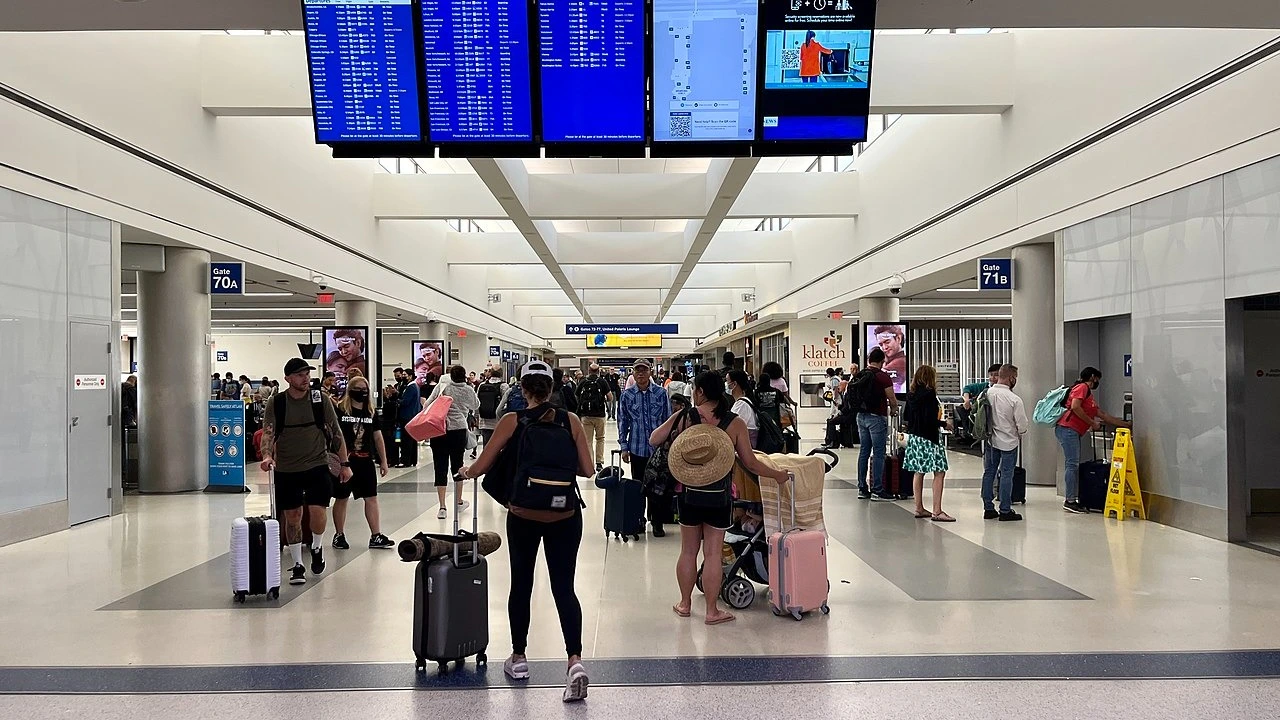
https://commons.wikimedia.org/wiki/File:Terminal_corridor_at_Los_Angeles_International_Airport_(July_2022).jpg
The Holiday is Busy, but Not Chaotic
International travel in 2025 has stabilized into a gentler upward trend. Travelers are still heading overseas, especially between Christmas and New Year’s, but not with the same intensity seen during the early “revenge travel” years.
Even so, airport staffing and CBP resource planning often lag behind shifting demand.
This creates an unusual dynamic during December: a busy travel season, but with uneven pressure on immigration lines depending on the airport and time of day. Some terminals manage the crowds smoothly; others face long queues even with lower arrival numbers.
Average Wait Times for Travelers
Despite the holiday rush, immigration and customs lines aren’t always as daunting as expected, as the following numbers show:
- The average processing time during the 2024 holiday travel period was 22 minutes.
- Nearly half of arriving passengers (45.5%) cleared immigration in 15 minutes or less.
- Only 5.8% waited more than an hour.
Two factors, however, can greatly affect how long you spend in line.
1. Arrival time
Landing between 5 a.m. and 3 p.m. typically results in about 26 percent longer waits compared to later in the day or overnight arrivals.
2. Citizenship status
Non-U.S. citizens wait significantly longer — nearly double — with average waits of 29.8 minutes compared with 15.1 minutes for U.S. passport holders.
These differences can play a major role in how smoothly your arrival unfolds.

Best and Worst Airports for International Arrivals
CBP tracks immigration wait times at 41 major U.S. airports, and the results reveal just how unpredictable the experience can be. Airport size, it turns out, doesn’t always correlate with efficiency.
Airports With the Longest Waits
These airports recorded the slowest processing times during the last holiday season:
| Airport | Average Holiday Wait Time |
|---|---|
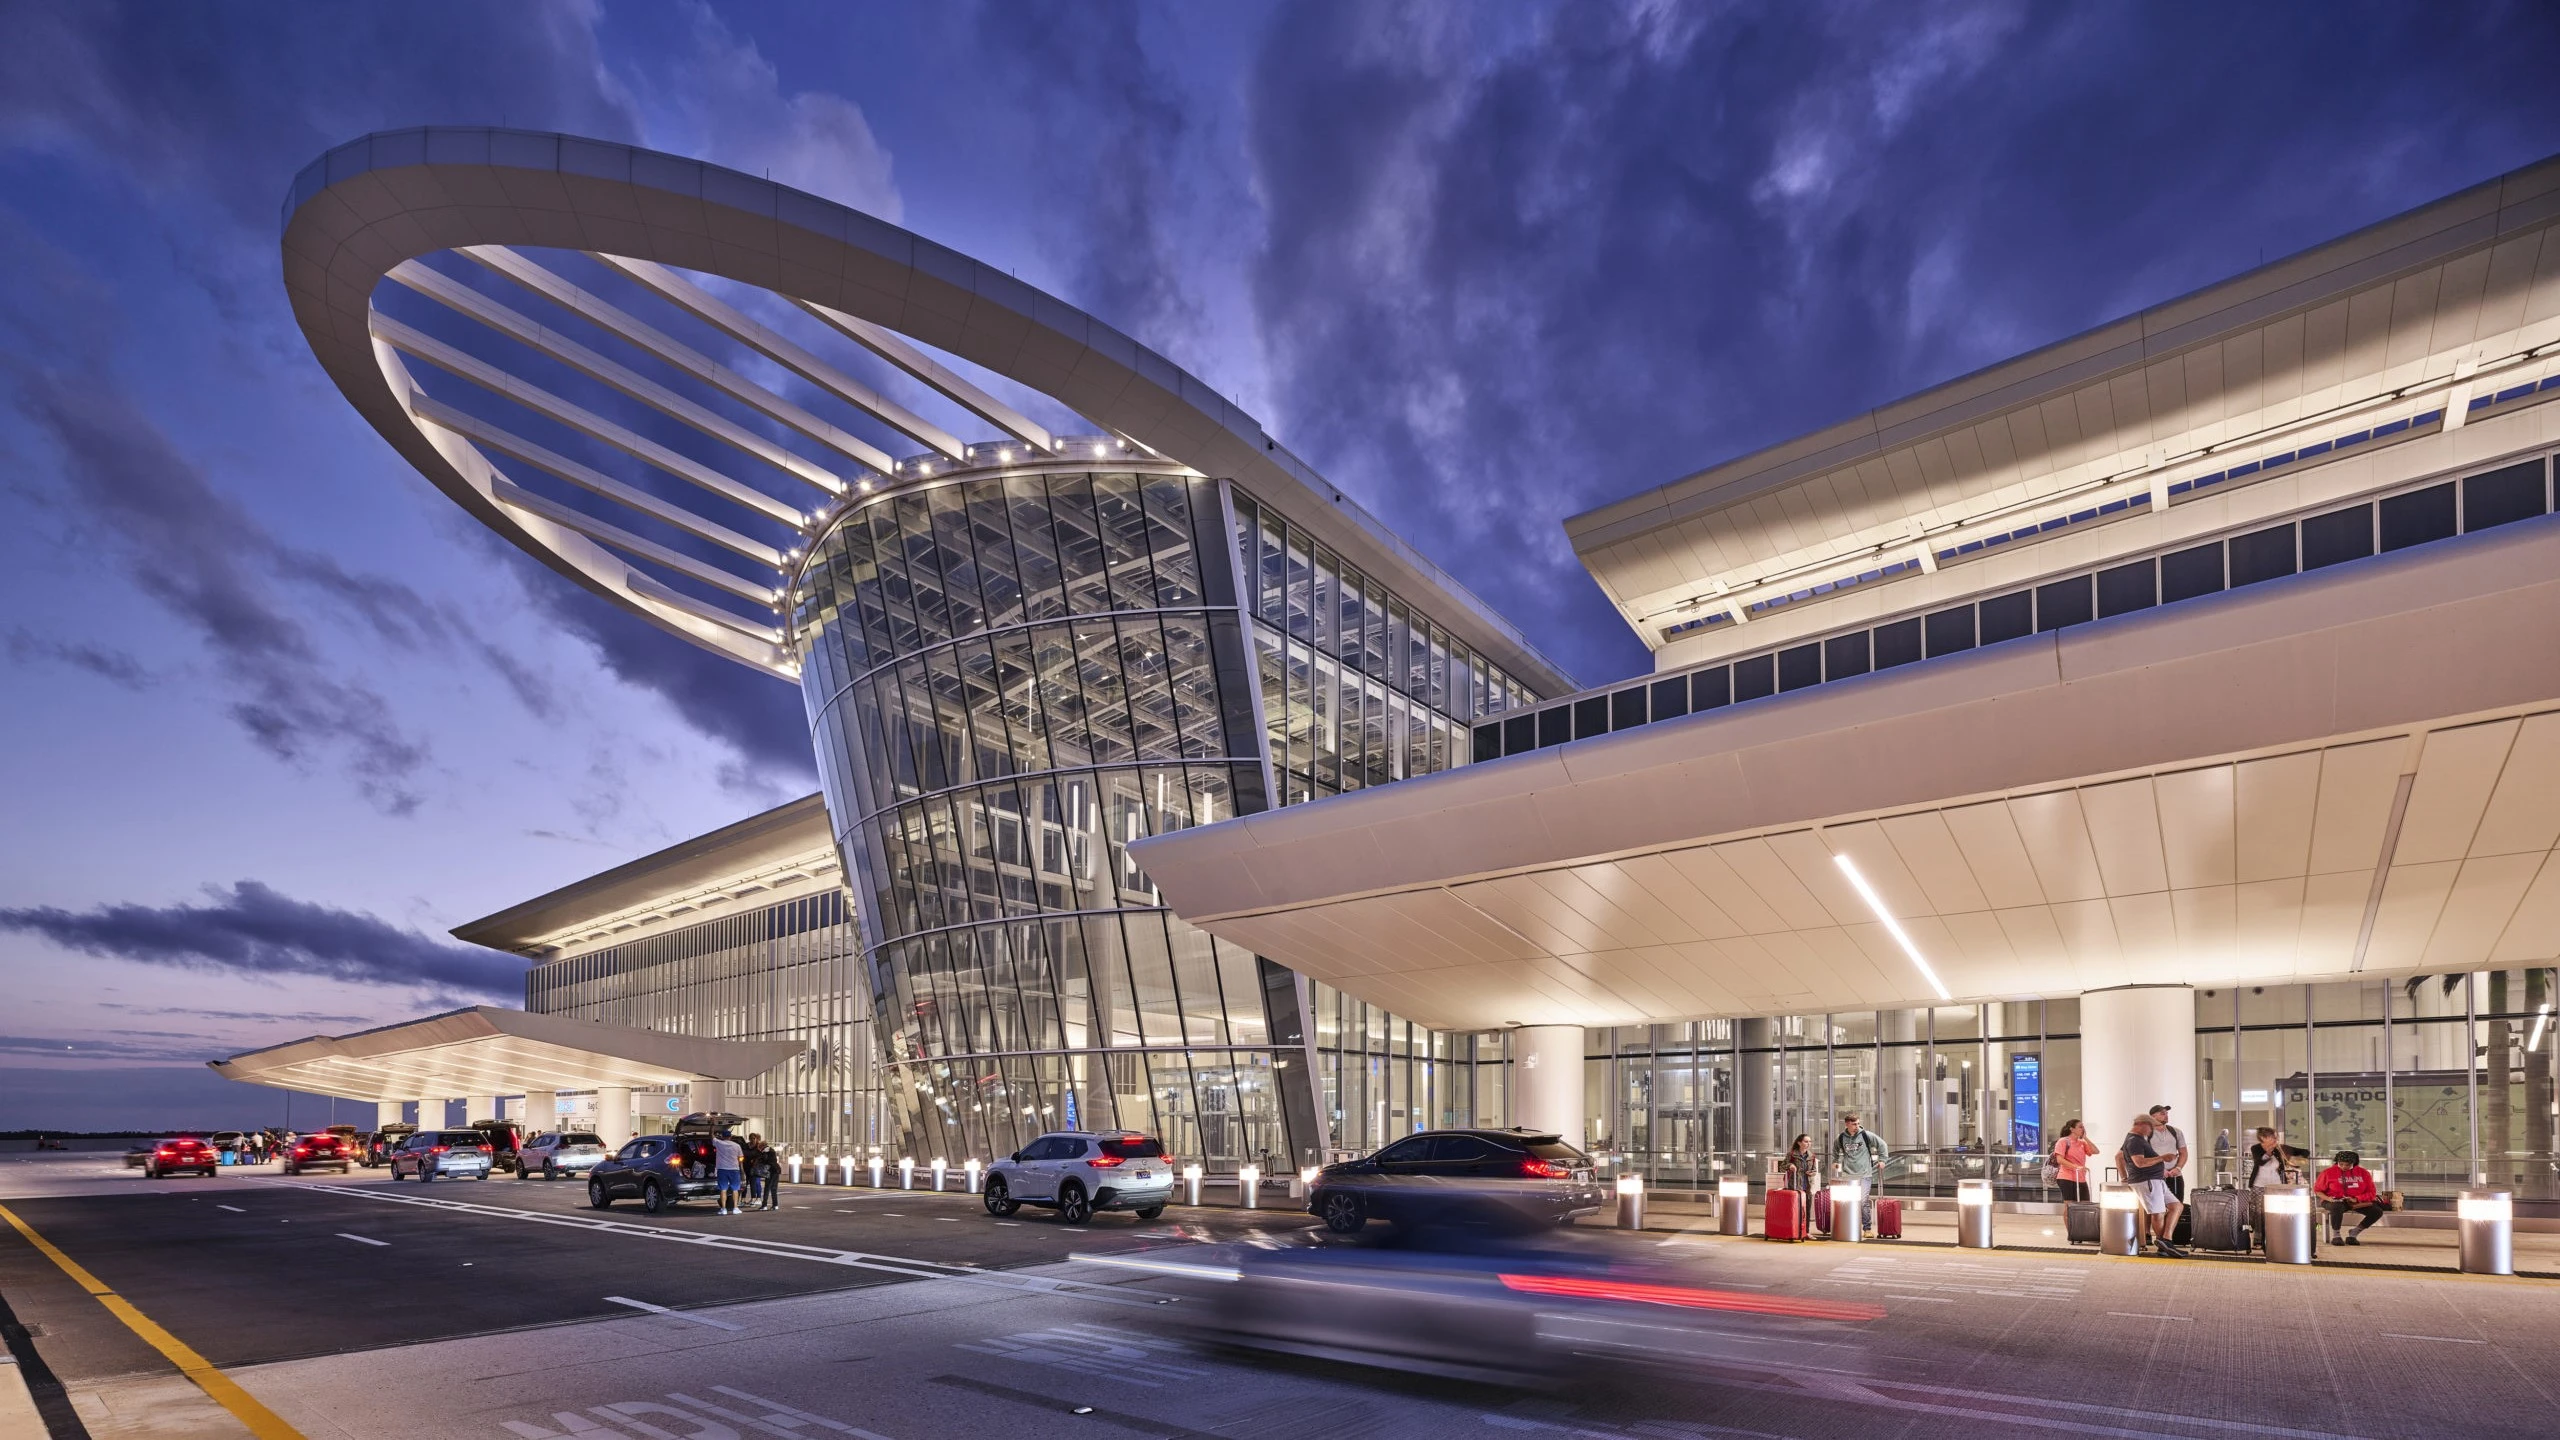
| Orlando (MCO) | 32.7 minutes |
| Los Angeles (LAX) | Among the slowest processing speeds |
| Nashville (BNA) | 27.9 minutes, despite low international traffic |
Orlando and Nashville stand out because their wait times remain high regardless of their very different passenger loads.
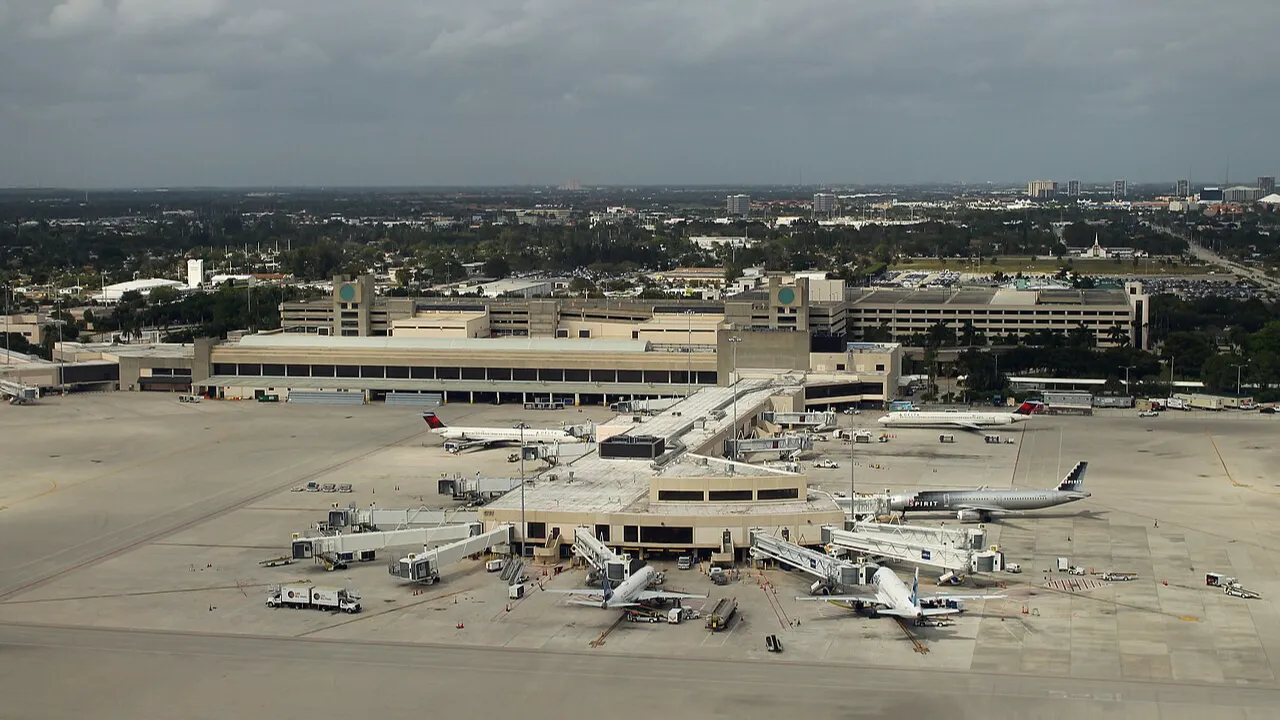
https://commons.wikimedia.org/wiki/File:Palm_Beach_International_Airport_-_Concourse_C_Aerial.jpg
Airports With the Fastest Arrivals
Several airports processed travelers at impressive speeds:
| Airport | Average Holiday Wait Time |
|---|---|
| Palm Beach (PBI) | 3.8 minutes |
| John Wayne (SNA) | 4.9 minutes |
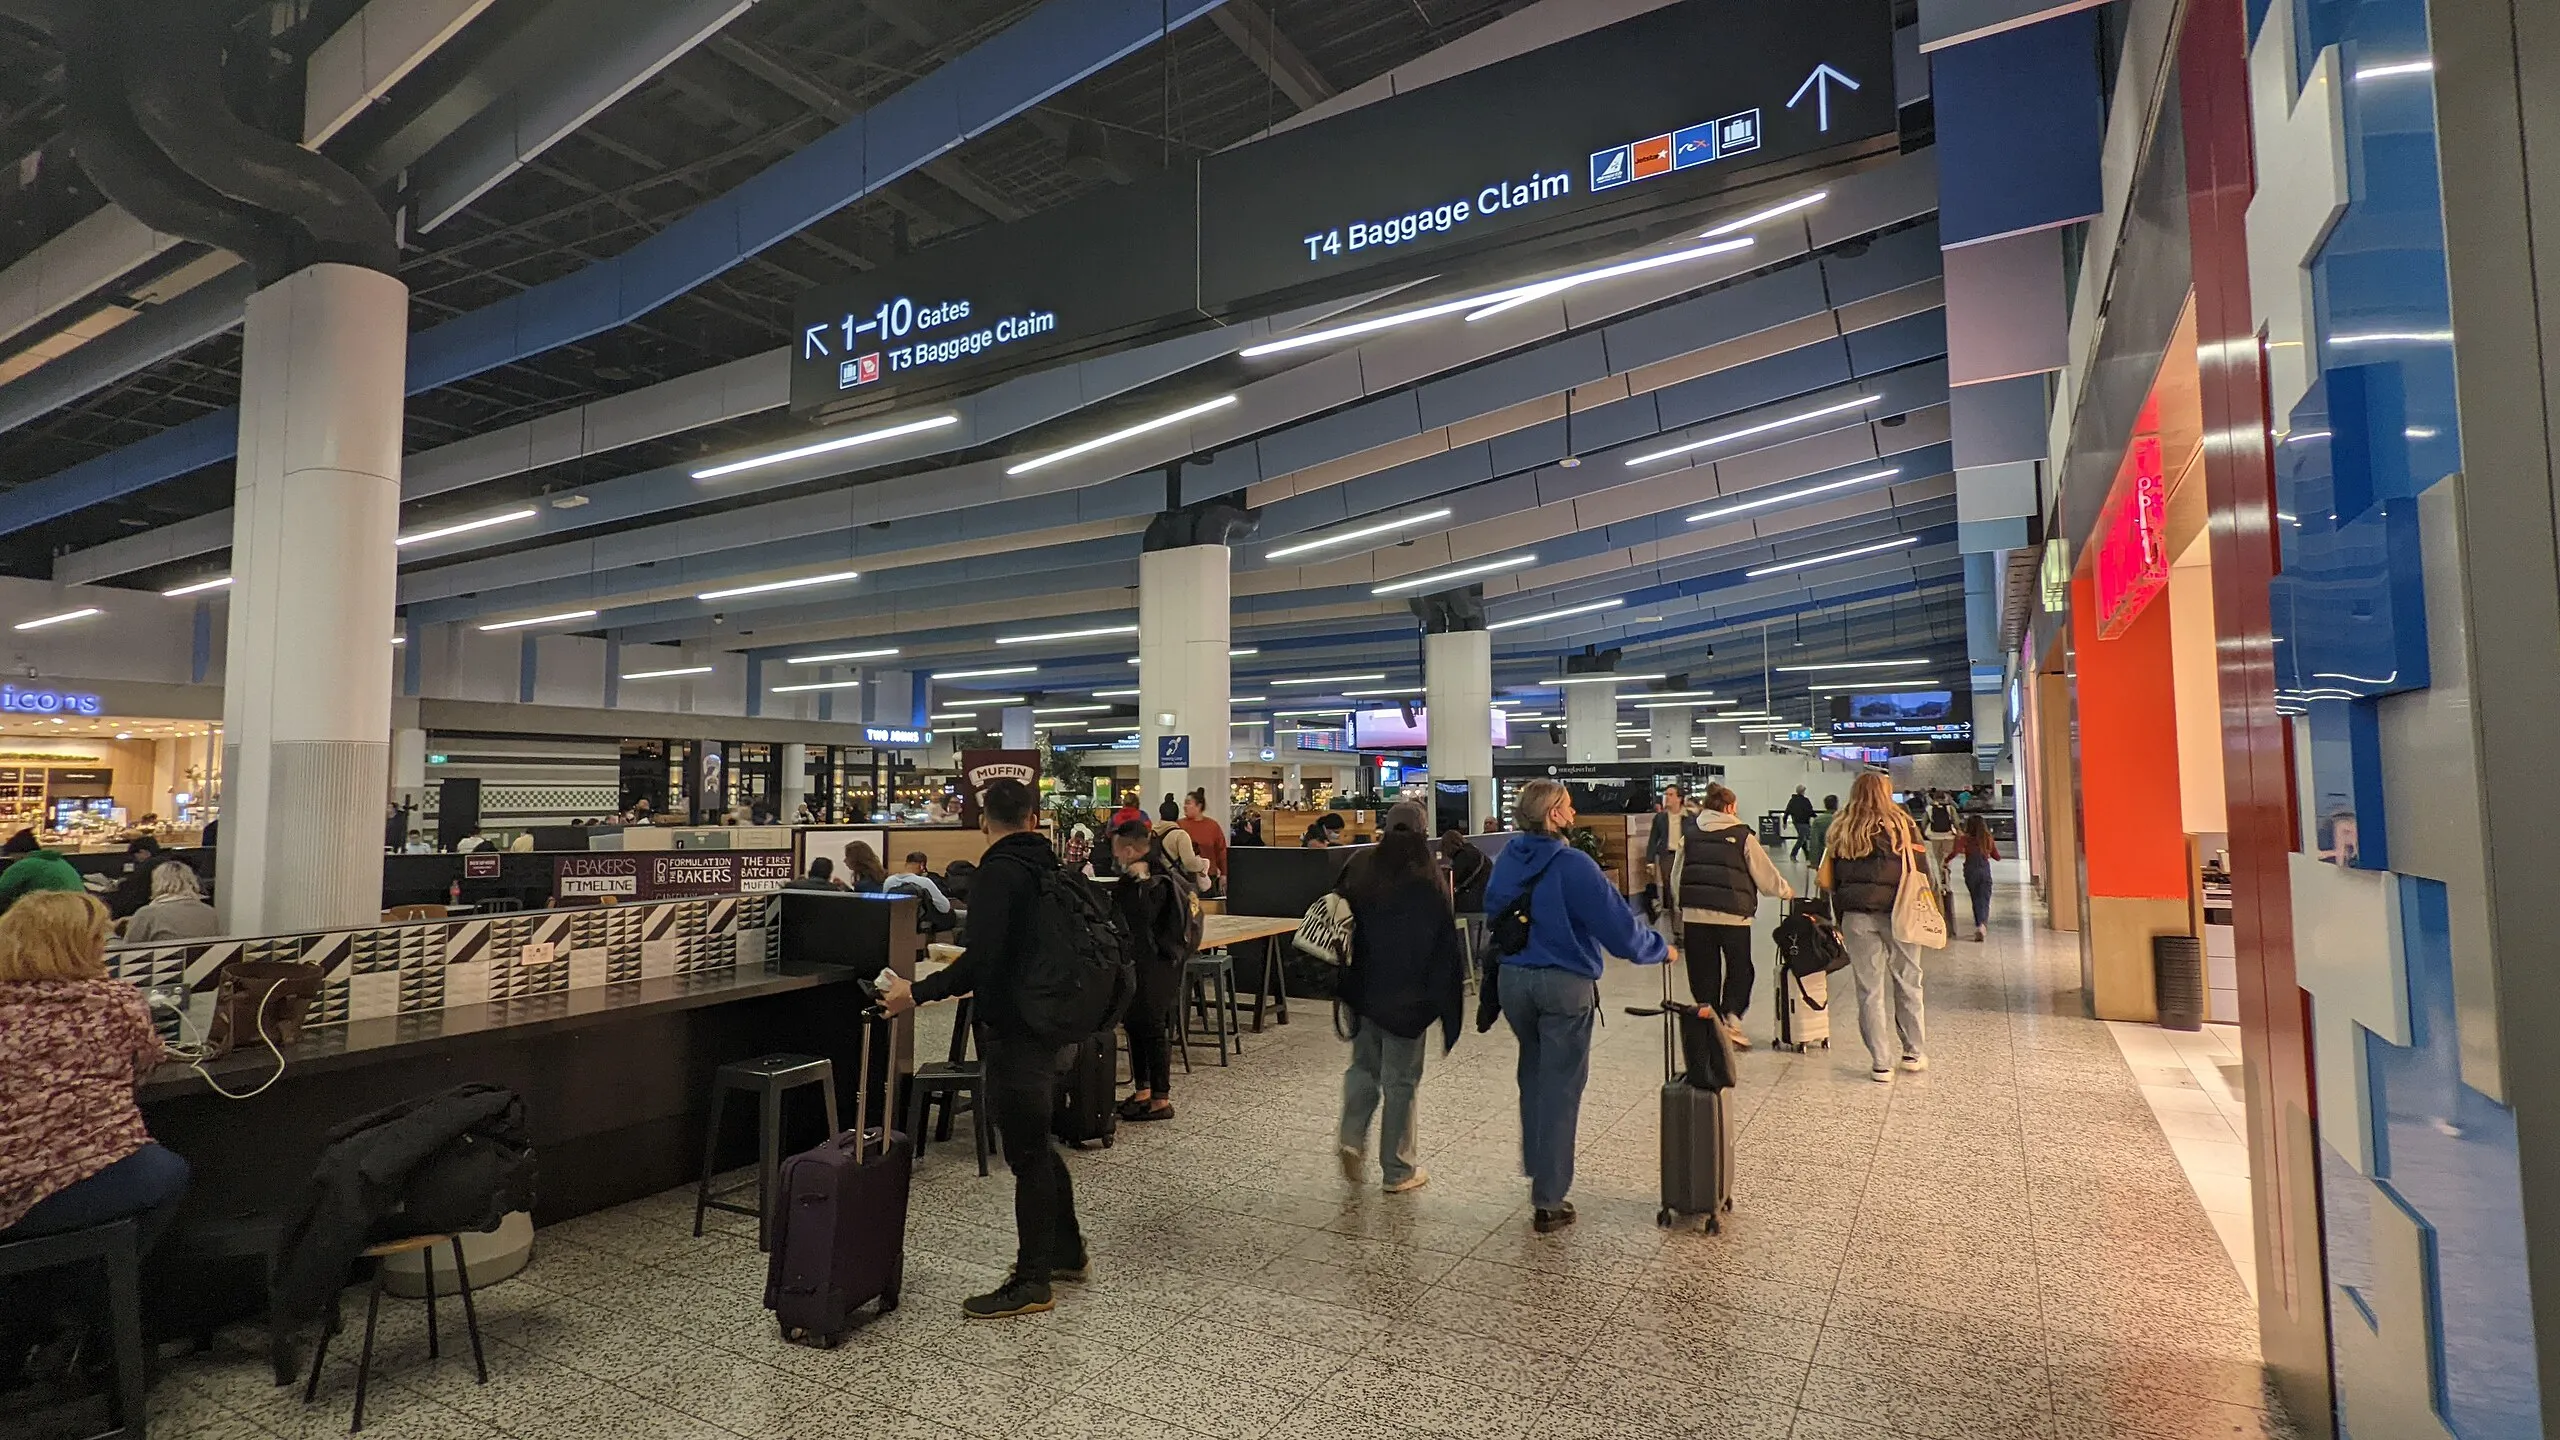
| Phoenix Sky Harbor (PHX) | Around 7 minutes |
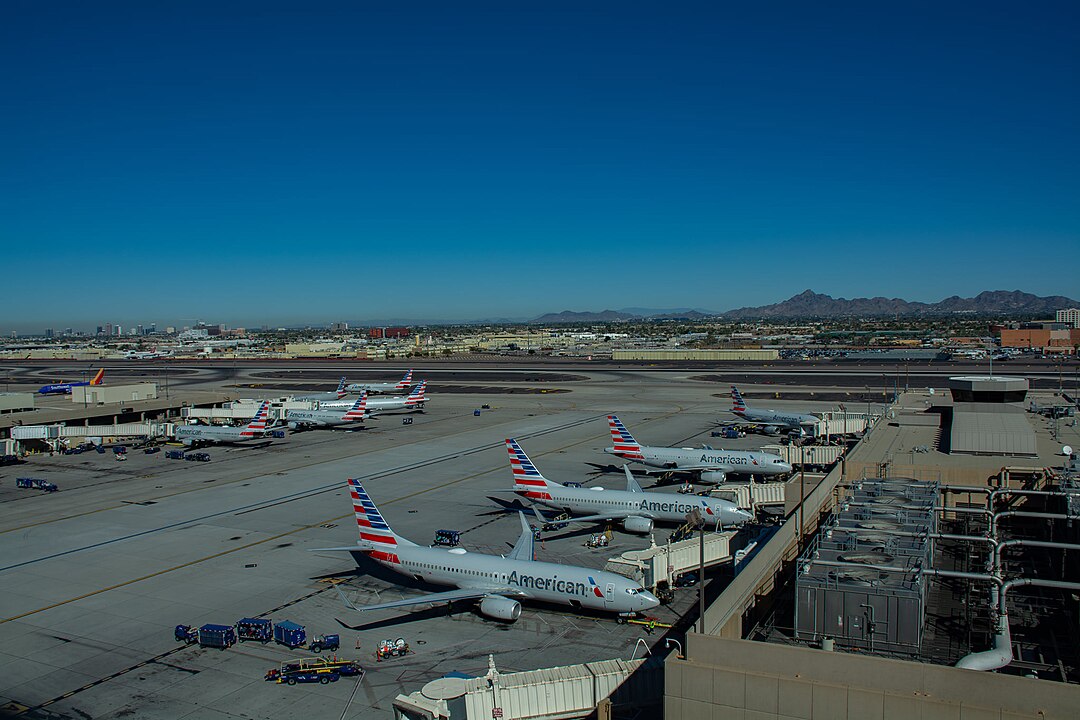
Phoenix is particularly notable. Despite handling nearly ten times more passengers than Palm Beach and John Wayne combined, it maintains one of the shortest wait times nationwide.
How to Speed Up Your Arrival
Even if you can’t choose your arrival airport, there are reliable ways to reduce the time you spend waiting in immigration lines.
Enroll in Global Entry
This is the fastest way to clear U.S. immigration. The Cost is $120 for five years. Many premium travel credit cards reimburse the fee. Children under 18 pay no fee when applying with a parent or guardian who is also applying or already enrolled.
For frequent international travelers, Global Entry is hard to beat.
Use the Mobile Passport Control App
A free, CBP-approved alternative available at more than 30 airports.
It allows travelers to bypass the main queue and head to a dedicated line.
Avoid peak arrival periods
Landing after 3 p.m. can reduce wait times significantly. Early-morning arrivals tend to face the longest delays.
Keep your travel documents handy
Mobile Passport, kiosks, and Global Entry lines move quickly. Having passports and confirmation details accessible helps you keep up with the flow.
Why Your Airport Choice Matters
Across the 41 tracked airports, holiday-season immigration wait times vary dramatically — from just under four minutes in Palm Beach to over 30 minutes in Orlando. With such a wide range, choosing your arrival airport can make a noticeable difference.
- Travelers returning from Europe or Latin America often have flexibility when selecting a first point of entry.
- Domestic connections after international flights can be routed through airports with historically faster processing.
- Holiday travelers visiting family may need to prepare for longer lines at congested hubs.
Even in a year where travel demand feels more balanced, immigration wait times remain uneven across the country.
Airport Delay and Performance Data
| Rank | Airport Name | Code | City, State | Avg Delay (min) | % On-Time | Departure Delay (min) | Arrival Delay (min) | Delay Increase YoY | Cancellation Rate |
|---|---|---|---|---|---|---|---|---|---|
| 1 | Orlando International Airport | MCO | Orlando, FL | 32.7 | 66.9% | 23.1 | 37.4 | 26.1% | 12.6% |
| 2 | Los Angeles International Airport | LAX | Los Angeles, CA | 30.3 | 75.5% | 20.1 | 41.4 | 29.5% | 11.5% |
| 3 | Nashville International Airport | BNA | Nashville, TN | 27.9 | 52.1% | 26.0 | 33.5 | 24.1% | 4.2% |
| 4 | Chicago O’Hare International Airport | ORD | Chicago, IL | 27.3 | 68.4% | 22.7 | 35.2 | 35.6% | 9.1% |
| 5 | Austin–Bergstrom International Airport | AUS | Austin, TX | 26.9 | 58.4% | 23.2 | 34.9 | 33.5% | 5.4% |
| 6 | Fort Lauderdale–Hollywood International | FLL | Fort Lauderdale, FL | 26.3 | 67.1% | 19.4 | 31.7 | 39.5% | 9.6% |
| 7 | John F. Kennedy International Airport | JFK | New York, NY | 26.1 | 63.7% | 14.6 | 35.2 | 39.7% | 8.5% |
| 8 | Miami International Airport | MIA | Miami, FL | 23.9 | 67.3% | 14.3 | 30.1 | 41.2% | 7.6% |
| 9 | San Diego International Airport | SAN | San Diego, CA | 23.4 | 43.6% | 20.9 | 29.3 | 31.0% | 1.3% |
| 10 | George Bush Intercontinental Airport | IAH | Houston, TX | 23.0 | 62.1% | 17.7 | 29.1 | 41.6% | 5.2% |
Source: Upgraded Points

Final Thoughts
The holidays will always bring busy airports, packed flights, and a rush of travelers returning home. But long immigration waits don’t have to be part of the journey.
By selecting efficient airports when possible, adjusting your arrival time, or enrolling in Global Entry or Mobile Passport, you can significantly reduce the time you spend in line.
For many travelers, saving even 15 to 20 minutes can make the difference between catching a connection and scrambling through the terminal.
As you plan your 2025 holiday travels, look beyond just the departure time and airfare. Your arrival airport might be the key to starting — or ending — your trip on a much smoother note.
Stay tuned with us. Further, follow us on social media for the latest updates.
Join us on Telegram Group for the Latest Aviation Updates. Subsequently, follow us on Google News