

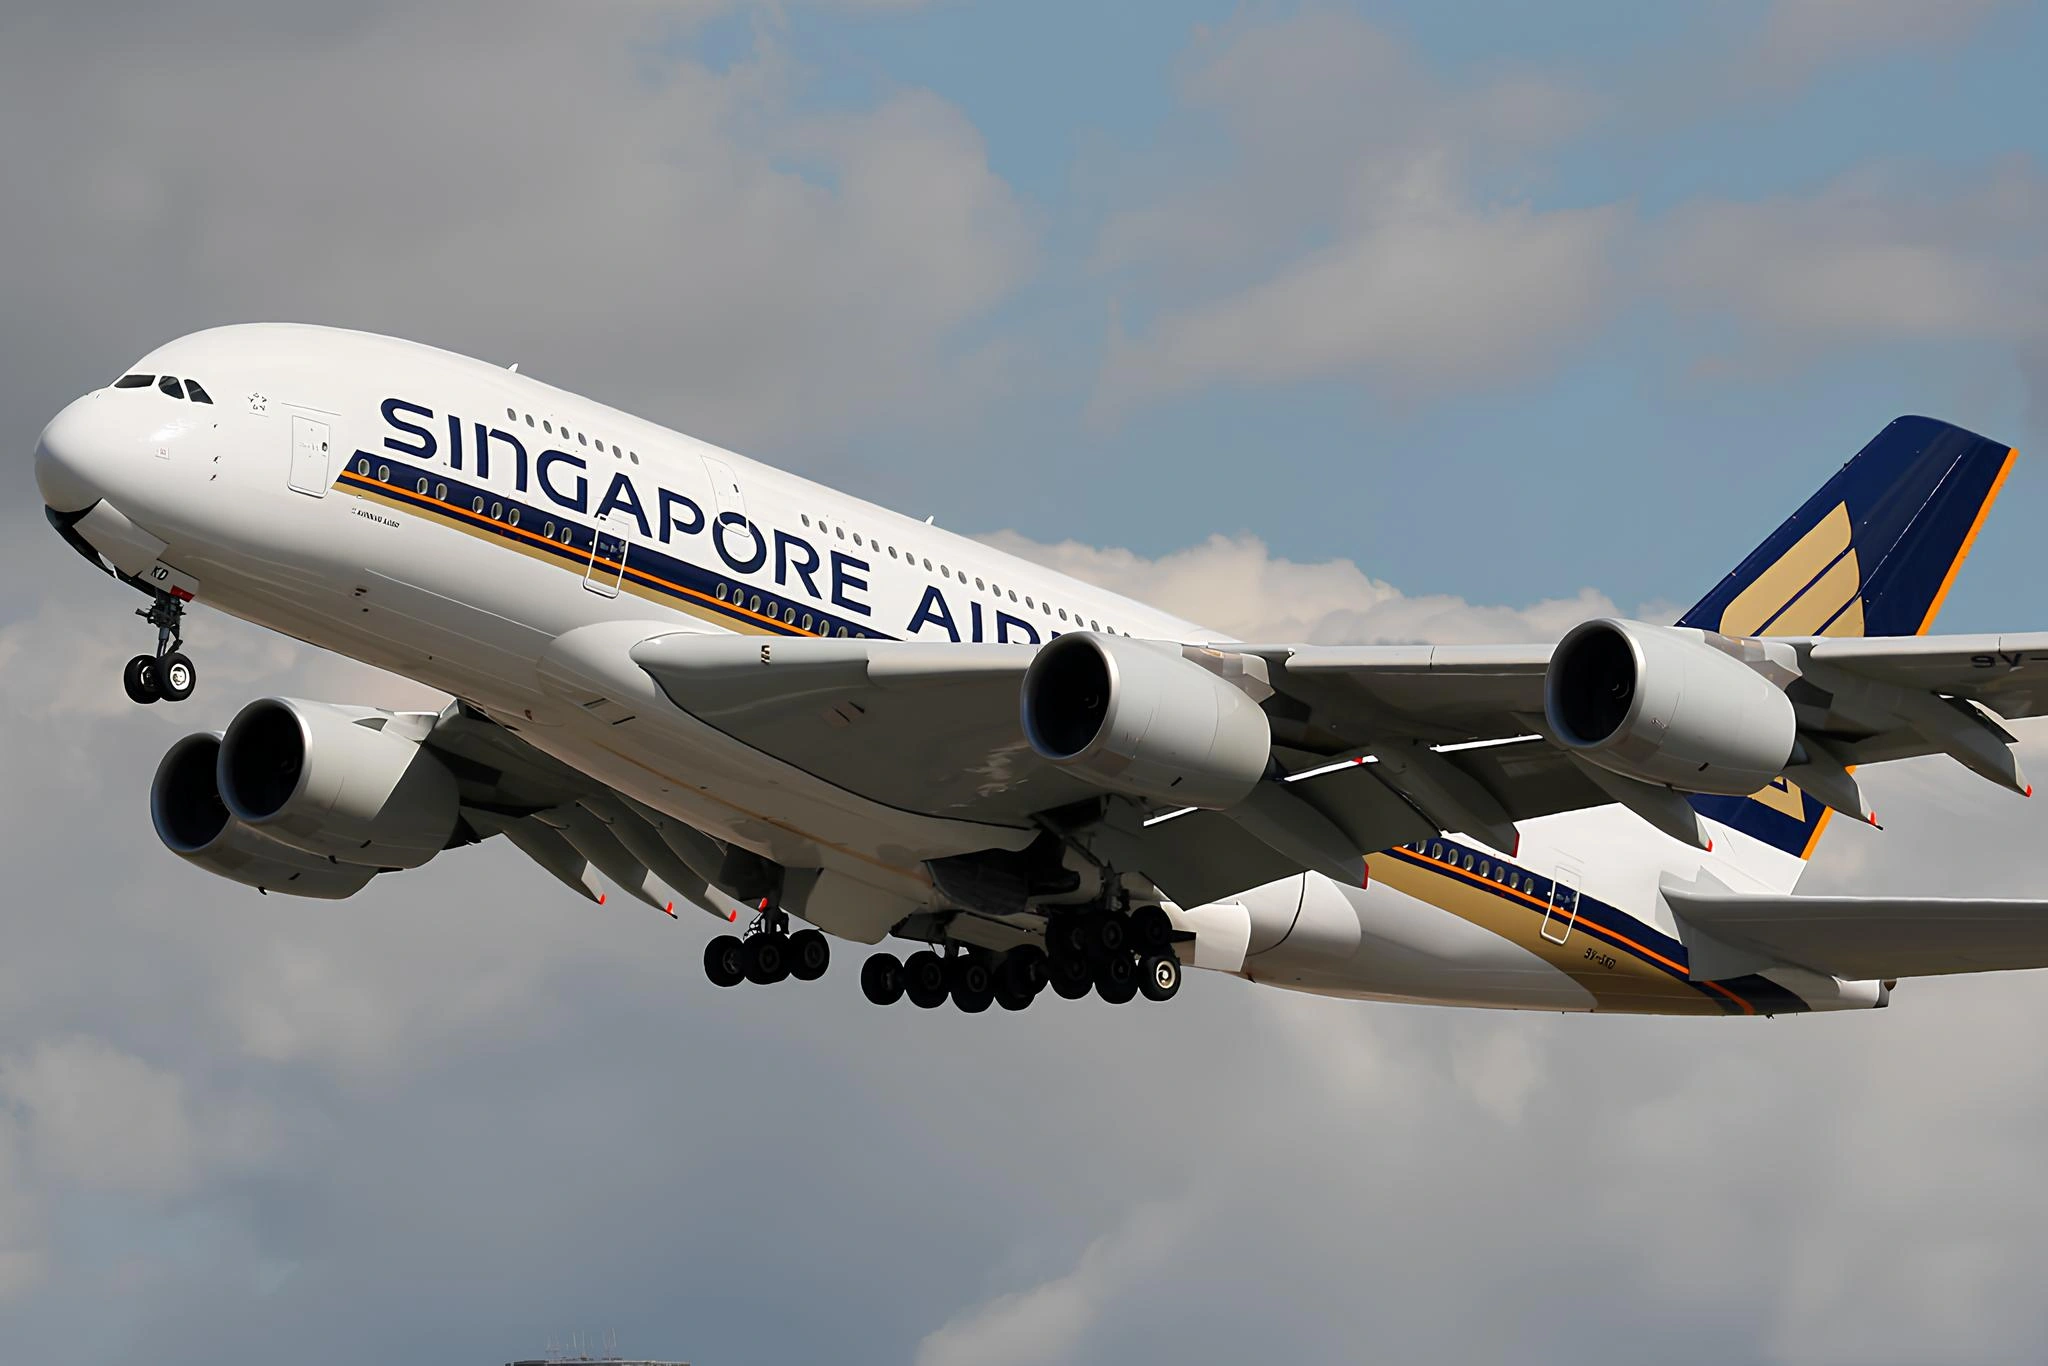
SINGAPORE- For the week commencing 14 December 2026, Singapore Airlines (SQ) has 1,250 scheduled passenger departures and 327,507 seats.
The figures put scheduled departures close to December 2019 levels while total seat capacity stands 2% above the pre-pandemic benchmark.
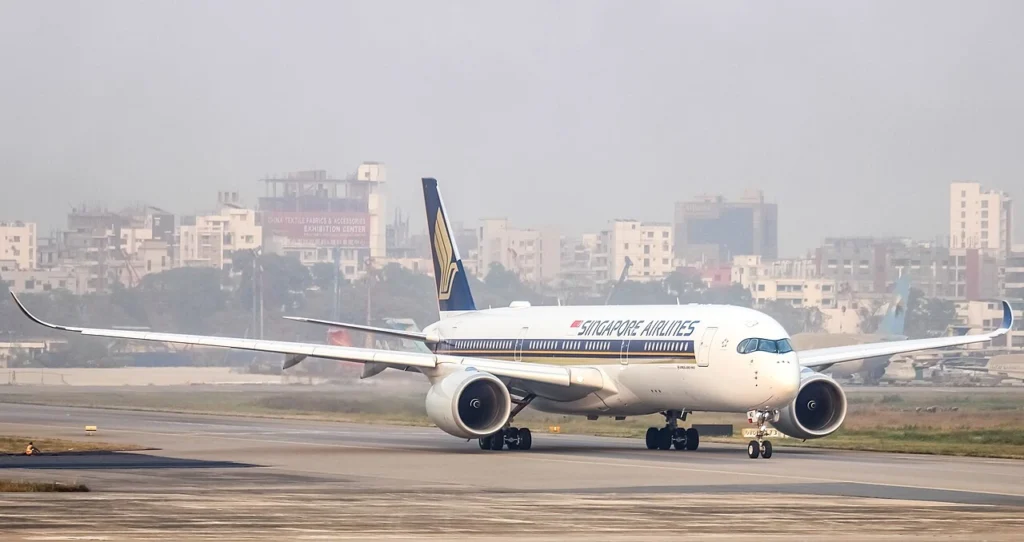
Singapore Airlines Busiest Routes in 2026
Singapore Airlines has largely restored its passenger network to its pre-pandemic scale, but the recovery differs significantly by destination. Jakarta remains its busiest market, while Bangkok and London have expanded through additional flights and seat capacity.
The rankings compare scheduled services for the week commencing 14 December 2026 with those for the week commencing 16 December 2019. They cover weekly seat capacity, flight frequency and Business Class seats. The December figures represent planned schedules rather than flights already operated.
Singapore Airlines has scheduled 1,250 passenger departures from Singapore for the selected December week. That is one departure below the combined Singapore Airlines and SilkAir total for the equivalent week in 2019, representing 99.9% of the earlier flight count.
The airline has also scheduled 327,507 seats, approximately 2% more than in the comparable pre-pandemic period.
Its monthly operating statistics also indicate that available seat-kilometres exceeded the former combined Singapore Airlines and SilkAir level for the equivalent month in every month from February 2026 onward.
Passenger numbers had also exceeded comparable pre-pandemic levels from January 2026. They peaked 10% above the earlier level in March 2026, when disruptions to capacity through Middle Eastern hubs redirected some Europe-bound demand towards Singapore Airlines.
These network-wide figures show that the airline has recovered its overall operating scale. However, they do not mean every destination has regained its former capacity or demand.
15 Busiest Routes by Weekly Seat Capacity
Jakarta ranks first by scheduled weekly seat capacity, followed by Bangkok and London. The table lists the one-way seat capacity from Singapore and the percentage difference reported against the pre-pandemic benchmark.
| Rank | Destination | Weekly seats | Reported difference vs. 2019 |
|---|---|---|---|
| 1 | Jakarta | 16,443 | 6% |
| 2 | Bangkok | 15,799 | 23% |
| 3 | London | 13,755 | 36% |
| 4 | Sydney | 12,684 | 6% |
| 5 | Kuala Lumpur* | 11,490 | 12% |
| 6 | Melbourne | 11,158 | 14% |
| 7 | Manila | 10,514 | 19% |
| 8 | Bali* | 10,311 | 5% |
| 9 | Tokyo | 10,297 | 17% |
| 10 | Shanghai | 9,625 | 3% |
| 11 | Hong Kong | 9,520 | 35% |
| 12 | Seoul | 9,198 | 9% |
| 13 | Perth | 8,960 | Not stated |
| 14 | Beijing | 8,449 | 25% |
| 15 | Brisbane | 8,134 | Not stated |
The ranking highlights the scale of Singapore Airlines’ regional network and its major long-haul markets.
Jakarta retains the lead despite a reduction in seats compared with 2019, while Bangkok and London have grown substantially.

15 Busiest Routes by Weekly Flight Frequency
Flight frequency provides a different view of network activity. Routes served by smaller aircraft can rank highly by the number of departures without having the greatest seat capacity.
| Rank | Destination | Weekly departures from Singapore | Reported difference vs. 2019 |
|---|---|---|---|
| 1 | Jakarta | 63 | At pre-pandemic level |
| 2 | Kuala Lumpur* | 54 | 22% |
| 3 | Bangkok | 49 | 17% |
| 4 | London | 42 | 50% |
| 5 | Bali* | 42 | 20% |
| 6 | Phuket* | 42 | 20% |
| 7 | Sydney | 35 | At pre-pandemic level |
| 8 | Melbourne | 35 | 9% |
| 9 | Manila | 35 | 25% |
| 10 | Tokyo | 35 | 17% |
| 11 | Hong Kong | 35 | 29% |
| 12 | Penang* | 35 | 17% |
| 13 | Shanghai | 28 | Not stated |
| 14 | Seoul | 28 | Not stated |
| 15 | Perth | 28 | Not stated |
Jakarta is the clear leader, with 63 weekly departures, equivalent to nine flights a day. Kuala Lumpur ranks second by frequency despite its remaining capacity shortfall.
According to Mainly Miles, London has 42 weekly departures, a substantial increase from its pre-pandemic schedule. Bali and Phuket also rank highly because of frequent regional services. These results show why flight frequency and seat capacity should be assessed separately.
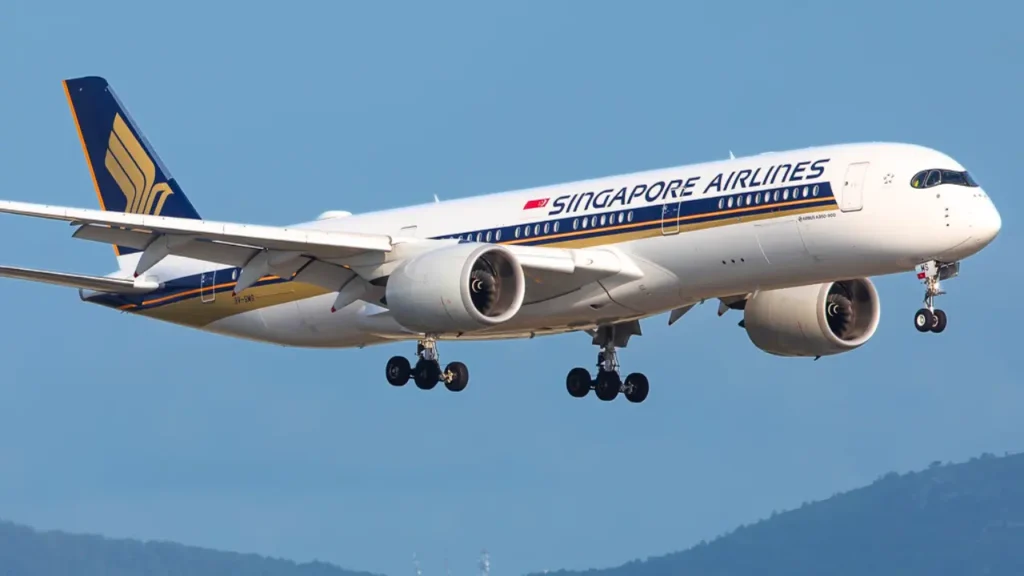
Why Jakarta, Bangkok and London Lead
Jakarta holds first place in both rankings, with 16,443 weekly seats and 63 scheduled departures from Singapore. Its 9 daily flights match the pre-pandemic frequency.
However, seat capacity remains 6% below the 2019 level. Singapore Airlines previously relied heavily on 284-seat Boeing 777-300 aircraft that were not the extended-range variant.
The airline has since retired those aircraft and now uses different capacity configurations, helping explain why matching the earlier flight frequency has not restored the same number of seats.
Jakarta’s position demonstrates that frequency alone does not determine capacity. Aircraft size and the number of seats installed on each aircraft also affect how many passengers an airline can carry.
Bangkok Records Strong Growth
Bangkok ranks second by seat capacity, with 15,799 seats each week and 49 scheduled departures.
The route offers 23% more seats than before the pandemic, while its weekly flight frequency is 17% higher.
Its strong position reflects the importance of Thailand to Singapore Airlines’ regional network. Bangkok serves both business and leisure travellers and benefits from frequent connections through Singapore.
London Becomes Major Growth Route
London ranks third by seat capacity, with 13,755 weekly seats. Its capacity is 36% above the 2019 level, while its 42 weekly departures represent a 50% increase.
The expansion is linked to the airline’s additional services at London Gatwick Airport, introduced in 2024.
The Gatwick route became daily in March 2025, and a second daily service began operating for much of the northern winter season in 2026.
With four daily departures at Heathrow and two at Gatwick, Singapore Airlines offers six daily flights between Singapore and London across the two airports. The expanded schedule strengthens London’s position among the airline’s largest long-haul markets.
Kuala Lumpur and Sydney Show Different Recovery Patterns
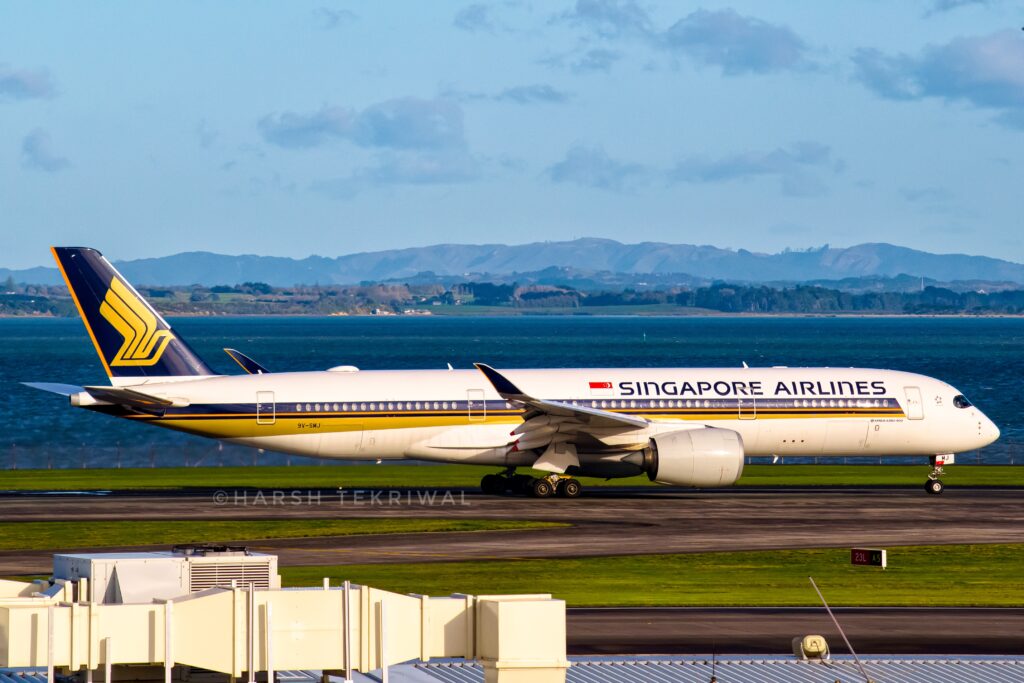
Kuala Lumpur ranks fifth by seats and second by flight frequency. It has 11,490 weekly seats and 54 scheduled departures.
Despite its high position, seat capacity remains 12% below the pre-pandemic level. Approximately 22% of the former weekly flight schedule has yet to return, according to the supplied analysis.
The route illustrates how a destination can retain a high frequency ranking while still operating below its former capacity. Its recovery remains incomplete even though it continues to be one of Singapore Airlines’ busiest regional markets.
Sydney ranks fourth by seat capacity, with 12,684 seats each week. The scheduled 35 weekly departures match the pre-pandemic frequency, but total seat capacity remains 6% lower.
The schedule now includes services associated with Western Sydney as well as the traditional Sydney airport operation. This means the airline’s services are spread across two airports, changing how its Sydney network is organised.
Sydney’s position improved compared with 2025, when it ranked eighth by seat capacity. However, its seat total has not yet returned to the 2019 benchmark.
Bali and Regional Routes Reflect Aircraft Choices
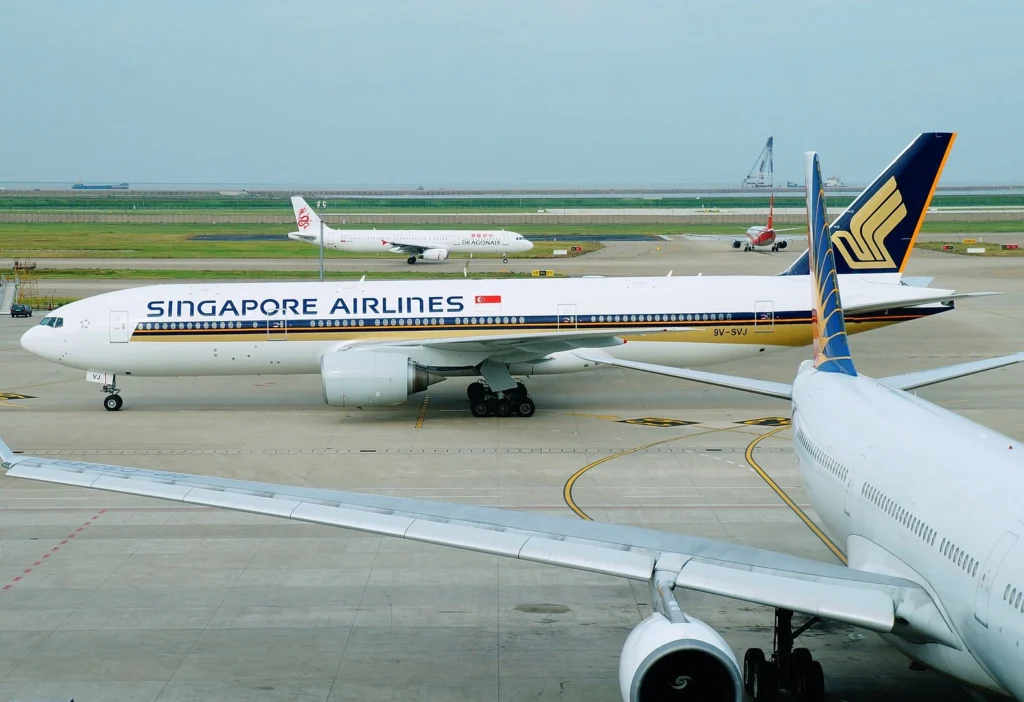
Bali ranks 8th by seat capacity, with 10,311 weekly seats and 42 departures. Although its weekly flight frequency is higher than before the pandemic, the number of seats available on the route has been influenced by aircraft selection.
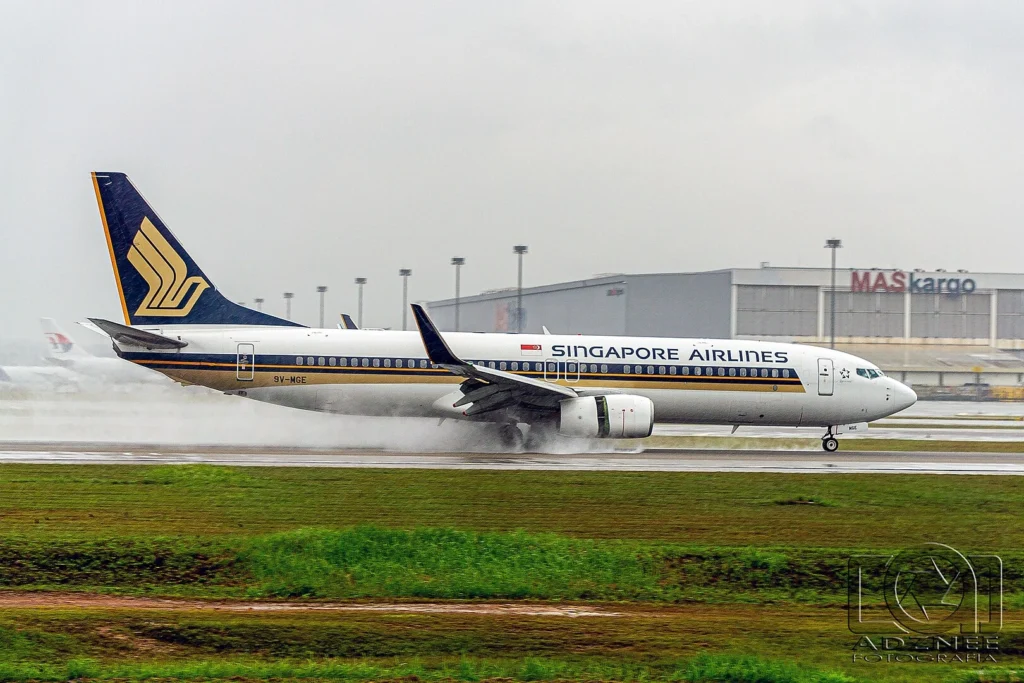
Singapore Airlines has increasingly deployed Boeing 737-8 MAX aircraft on Bali services in place of some wide-body aircraft. Smaller aircraft can support regular departures while reducing the number of seats offered on each flight.
Phuket and Penang also feature in the top 15 by weekly frequency. Their rankings reinforce the importance of short-haul regional markets, where multiple daily departures can matter more to the frequency ranking than aircraft size.
Tokyo and Hong Kong Continue to Lag
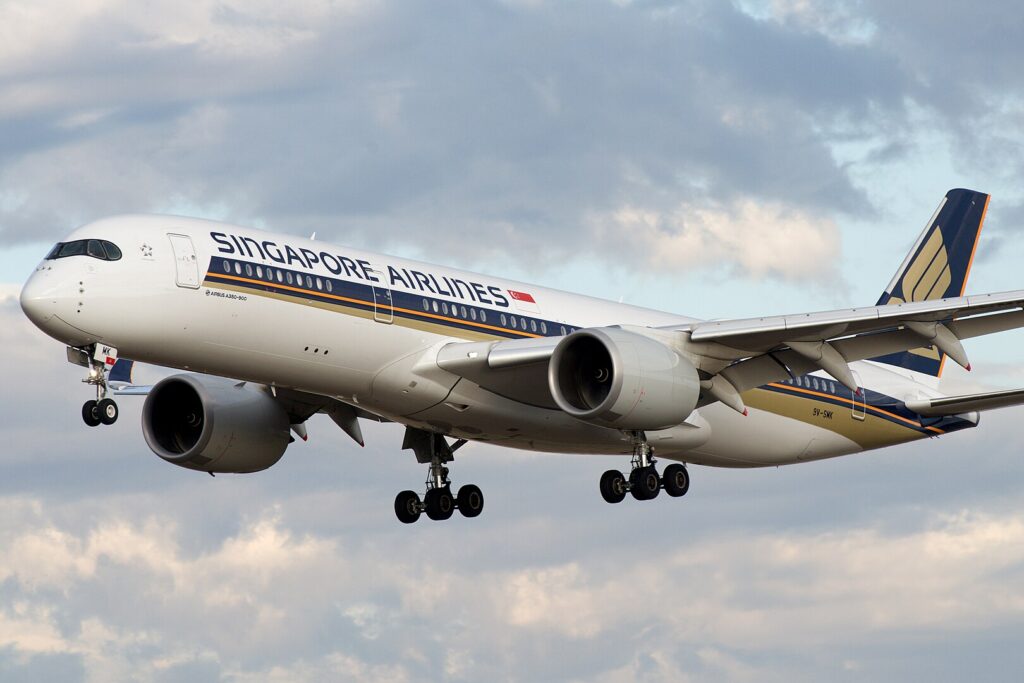
Tokyo has experienced one of the largest declines among Singapore Airlines’ major routes. It ranks ninth by seat capacity, with 10,297 weekly seats, down 17% from pre-pandemic levels.
The airline has 35 scheduled weekly departures to the Japanese capital, compared with 41 in the equivalent week of December 2025. The source analysis also indicates that current weekly flight frequency remains at approximately 83% of the pre-pandemic level.
Aircraft changes have further reduced premium capacity. Singapore Airlines previously operated larger aircraft on Tokyo routes, including the Airbus A380 and Boeing 777-300. Some flights now use the Boeing 787-10, which provides fewer Business Class seats than those larger aircraft.
This shift affects both the number of seats available overall and the number allocated to Business Class. Travellers seeking premium award seats may therefore face a smaller pool of available seats than the flight count alone suggests.
Hong Kong ranks eleventh by both weekly seat capacity and flight frequency. Singapore Airlines offers 9,520 weekly seats on the route, 35% fewer than in 2019. Its 35 weekly departures are also below the earlier level.
The route’s slower recovery may reflect weaker demand, although schedule data alone cannot establish a single cause. Hong Kong experienced prolonged pandemic-related travel restrictions and reopened more slowly than Singapore. Its airport passenger traffic in 2025 remained 15% below the 2019 level, while Singapore Changi Airport had already returned above its pre-pandemic level in the first quarter of 2024.
The Singapore to Hong Kong route has also seen limited signs of a full return to its earlier network structure. Greater Bay Airlines discontinued its new non-stop service after about one month in 2024, citing commercial reasons. Singapore Airlines has also not restored its former Singapore to Hong Kong to San Francisco service, which was suspended in January 2022.
These developments underline the difference between overall network recovery and recovery on individual routes. Hong Kong remains an important market, but Singapore Airlines’ scheduled capacity is still materially below its earlier level.
Singapore Airlines’ Busiest Routes by Business Class
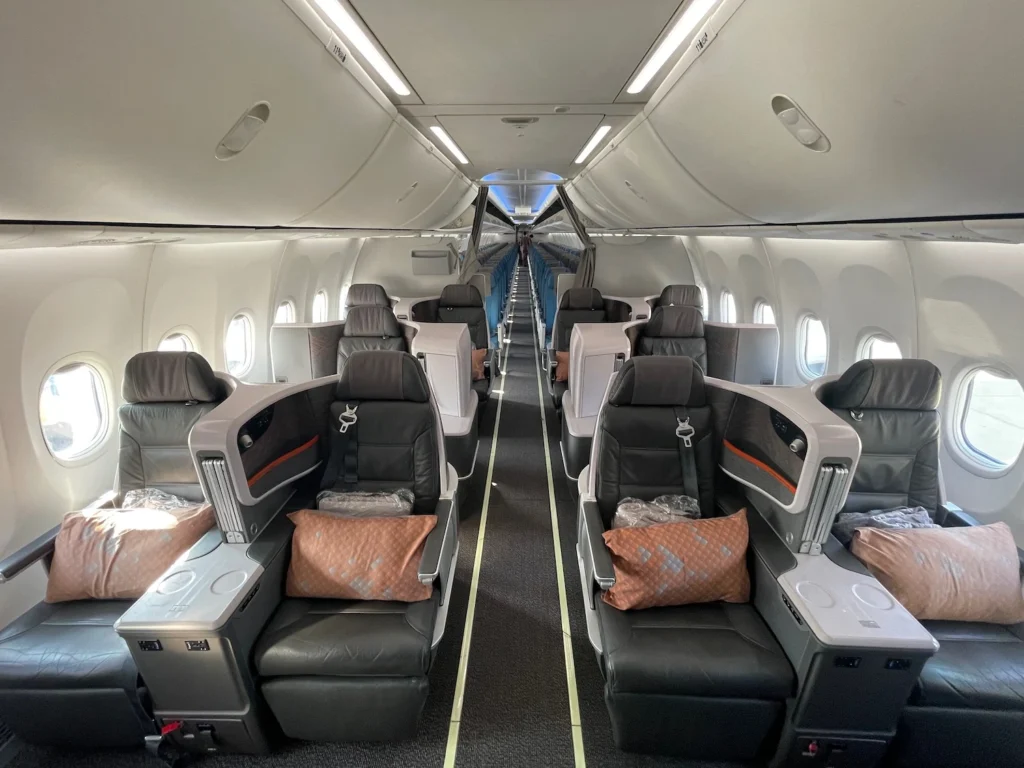
Business Class capacity provides another way to assess the airline’s network. It reflects not just the number of flights but also aircraft configuration and the number of premium seats installed on each aircraft.
The following table ranks the 15 destinations by scheduled weekly one-way Business Class seat capacity from Singapore.
| Rank | Destination | Weekly Business Class seats | Reported difference vs. 2019 |
|---|---|---|---|
| 1 | Jakarta | 2,716 | 3% |
| 2 | London | 2,310 | 41% |
| 3 | Sydney | 1,988 | 1% |
| 4 | Bangkok | 1,848 | 31% |
| 5 | Melbourne | 1,736 | 3% |
| 6 | Tokyo | 1,484 | 28% |
| 7 | Hong Kong | 1,470 | 37% |
| 8 | Shanghai | 1,414 | 4% |
| 9 | Kuala Lumpur* | 1,348 | 5% |
| 10 | New York | 1,274 | 43% |
| 11 | Beijing | 1,148 | 5% |
| 12 | Brisbane | 1,134 | Not stated |
| 13 | Manila | 1,078 | 5% |
| 14 | Perth | 1,064 | Not stated |
| 15 | Seoul | 1,036 | 10% |
Jakarta Retains the Business Class Lead
Jakarta ranks first with 2,716 weekly Business Class seats. London follows with 2,310, while Sydney ranks third with 1,988.
The premium-seat ranking differs from the overall capacity ranking because each aircraft type has a different cabin layout. A route may offer many economy seats but fewer Business Class seats if its aircraft configuration allocates less space to the premium cabin.
London, New York and Bangkok Expand Premium Capacity
London offers 41% more Business Class seats than in 2019. New York has increased its weekly Business Class capacity by 43%, while Bangkok has expanded by 31%.
Additional flight frequencies contribute to these increases. However, more scheduled Business Class seats do not guarantee that discounted or Saver award seats will be available on every departure. Award availability remains dependent on the inventory released for redemption.
Tokyo and Hong Kong Offer Fewer Business Class Seats
Tokyo’s weekly Business Class seat capacity is 28% below the pre-pandemic level, a steeper decline than its 17% reduction in total seat capacity. The shift towards smaller aircraft with fewer premium seats helps explain the difference.
Hong Kong has 37% fewer Business Class seats than in 2019. It ranked second among Singapore Airlines’ routes by Business Class capacity before the pandemic but now occupies seventh place.
The reduction in premium seats matters to travellers seeking Business Class award tickets. A route can continue to have regular flights while offering fewer premium seats because of reduced frequencies, smaller aircraft or changes in cabin configuration.
Other Changes to Singapore Airlines Network
Singapore Airlines has added several destinations or airports to its network in recent years, including Brussels, London Gatwick, Beijing Daxing, Hangzhou, Madrid and Western Sydney.
These additions show that its post-pandemic network is not simply a return to the former schedule. It also reflects changes in route strategy and the airports used to serve major cities.
The supplied analysis also reports that Houston services ended in early 2025, Dubai remained suspended, and the planned Riyadh relaunch continued to be delayed. Such changes affect the shape of the network even when the airline’s overall flight and seat totals have recovered.
For a full assessment of network development, route additions, suspensions and aircraft assignments should be considered alongside the busiest-route rankings.
Bottom Line
Singapore Airlines has restored its scheduled network to almost the same flight scale as December 2019 and now offers around 2% more seats overall.
Jakarta remains its busiest route by both weekly capacity and departure frequency, while Bangkok and London have expanded beyond their pre-pandemic levels.
The recovery remains uneven. Kuala Lumpur and Sydney have not fully restored their former seat capacity, while Tokyo and Hong Kong continue to show notable shortfalls. Aircraft selection also affects the number of seats offered, particularly in Business Class.
For travellers, the rankings provide useful context on route frequency and cabin capacity. However, scheduled seat totals should not be treated as direct measures of passenger demand or as guarantees of award availability.
Stay tuned with us. Further, follow us on social media for the latest updates.
Join us on Telegram Group for the Latest Aviation Updates. Subsequently, follow us on Google News
