
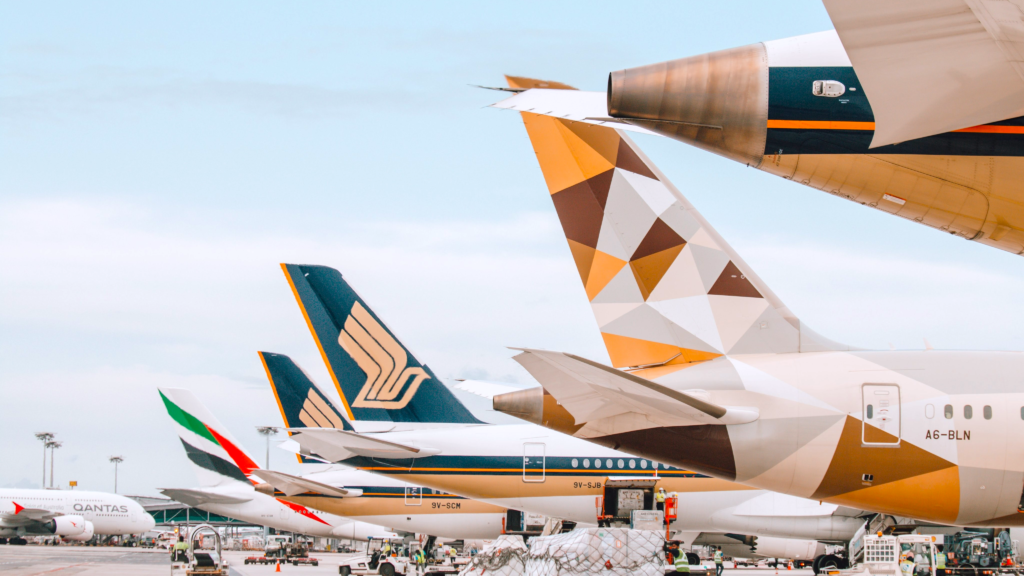
SINGAPORE- Qatar Airways (QR), headquartered at Hamad International Airport (DOH), has secured the top position among the world’s largest airlines for carbon emission efficiency in the 2025 EmeraldSky Annual Review published by Cirium.
The Doha (DOH)-based carrier recorded 60.0 grams of CO₂ per available seat kilometre (ASK), placing it ahead of Ryanair (FR) at 62.7g and Turkish Airlines (TK) at 64.2g in the global ranking of the ten largest carriers by total ASK.
The EmeraldSky framework evaluates the environmental performance of the world’s 100 largest airlines by measuring CO₂ emissions per ASK, a standardised metric that enables fair comparison across carriers of different sizes and route networks.
The 2025 review also separates belly cargo emissions from passenger emissions, ensuring that widebody operators carrying significant freight are not unfairly penalised in the rankings.
10 Most Efficient Airlines in 2025
The global top 20 ranking orders airlines by the lowest CO₂ per ASK. However, efficiency and scale operate independently. An airline can achieve strong per-seat-kilometre efficiency while producing modest total emissions due to its smaller operation.
Conversely, a very large carrier may rank lower on the efficiency table but generate far greater total emissions simply because it operates more flights over longer distances.
The EmeraldSky Review addresses this by separately ranking the ten largest airlines in the world by total ASK and displaying their emissions intensity alongside total passenger CO₂ output. Qatar Airways (QR) leads this group at 60.0g CO₂ per ASK, followed by Ryanair (FR) at 62.7g and Turkish Airlines (TK) at 64.2g.
The data reveals how different these airlines are in their operations. Some carriers fly over two million flights a year across short and medium-haul networks, while others operate fewer than 200,000 flights but cover far greater distances using widebody equipment.
World’s Largest Airlines by ASK: Ranked by CO₂ Efficiency
| Rank | Airline (Group) | Country | CO₂/ASK (g) 2025 | % Change vs 2024 | Total Pax CO₂ (mt) 2025 | CO₂ Change vs 2024 | Flights (thousands) 2025 | Flight Change vs 2024 | Avg. Seats 2025 | Avg. Fleet Age (y) | Avg. Flight Distance (km) |
|---|---|---|---|---|---|---|---|---|---|---|---|
| 1 | Qatar Airways (QR) | Qatar | 60.0 | +0.3% | 15.4 | +0.4% | 198 | -1.1% | 278 | 10.2 | 4,221 |
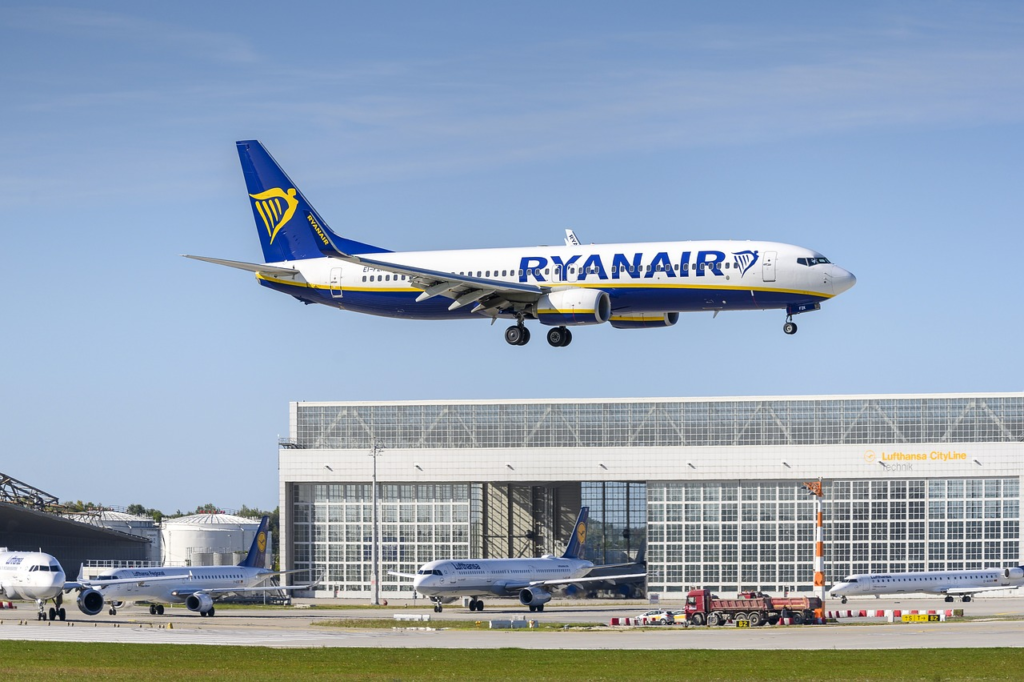
| 2 | Ryanair (FR) | Ireland | 62.7 | -1.0% | 17.4 | +4.3% | 1,148 | +4.2% | 191 | 10.1 | 1,264 |
| 3 | Turkish Airlines (TK) | Turkey | 64.2 | -0.9% | 15.8 | +2.9% | 428 | -0.1% | 204 | 9.7 | 2,332 |
| 4 | Southwest Airlines (WN) | USA | 67.8 | -1.6% | 19.7 | -0.1% | 1,422 | -1.9% | 161 | 11.7 | 1,252 |
| 5 | Emirates (EK) | UAE | 68.0 | +1.4% | 25.4 | +5.9% | 181 | +5.2% | 408 | 11.1 | 4,902 |
| 6 | United Airlines (UA) | USA | 69.9 | -0.2% | 37.4 | +6.0% | 1,728 | +7.2% | 131 | 14.6 | 1,735 |
| 7 | China Southern Airlines (CZ) | China | 71.4 | -2.3% | 17.9 | +3.0% | 792 | +0.9% | 182 | 9.5 | 1,603 |
| 8 | Delta Air Lines (DL) | USA | 72.1 | +0.3% | 34.8 | +3.6% | 1,801 | +4.9% | 138 | 14.8 | 1,517 |
| 9 | American Airlines (AA) | USA | 75.0 | +0.1% | 36.2 | +2.6% | 2,245 | +3.1% | 124 | 14.4 | 1,354 |
| 10 | China Eastern Airlines (MU) | China | 77.6 | -1.2% | 18.1 | +6.1% | 861 | +3.2% | 168 | 9.4 | 1,463 |

How Cirium’s EmeraldSky Framework Measures Airline Emissions
Cirium’s EmeraldSky Annual Review evaluates the environmental performance of the world’s 100 largest airlines based on CO₂ emissions per available seat kilometre.
ASK is calculated by multiplying the number of seats available on a flight by the distance travelled. By assessing emissions relative to this metric, the ranking reflects how efficiently airlines utilise capacity while minimising environmental impact.
A key feature of the framework is its treatment of belly cargo. Passenger widebody aircraft frequently carry significant freight in the lower deck alongside passengers. If all fuel burn is attributed to passengers on an aircraft that also carries 20 tonnes of freight, the resulting passenger emissions figure is overstated and penalises the airline unfairly.
The EmeraldSky framework removes the impact of belly cargo on passenger emissions. This adjustment improves fairness for airlines operating long-haul widebody fleets and ensures that the rankings reflect passenger operations rather than freight logistics.
What Drives Qatar Airways’ Leading Position
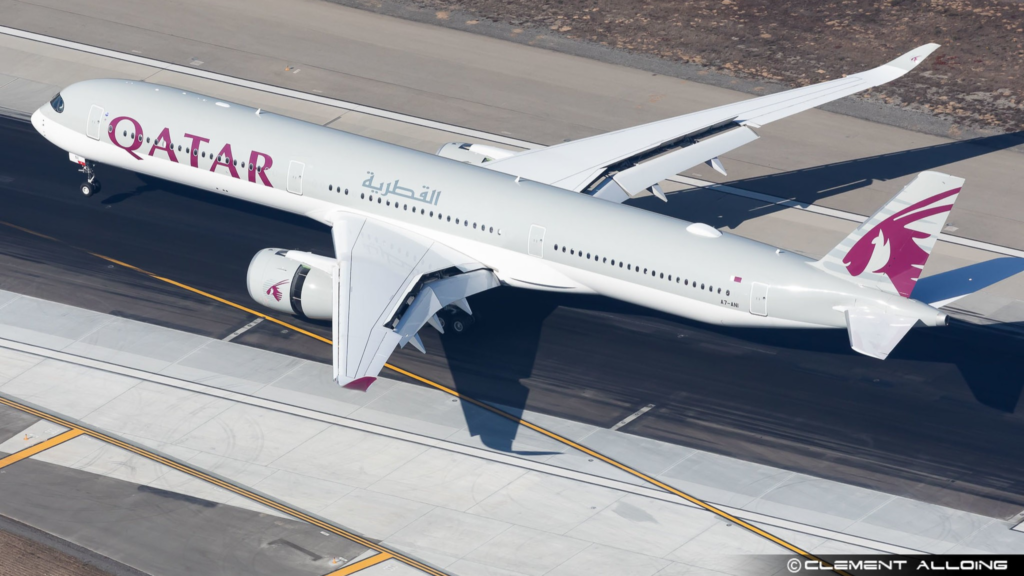
Qatar Airways (QR) achieved an emissions intensity of approximately 60 grams of CO₂ per ASK, one of the lowest figures among the world’s largest airlines.
The airline’s operational model plays a central role in this result. With an average flight distance exceeding 4,221 kilometres, Qatar Airways (QR) operates one of the most extensive long-haul networks globally. Despite this, its relatively modern fleet, averaging 10.2 years, supports reduced fuel consumption and lower emissions per seat.
The carrier has pursued a strategy focused on incremental efficiency gains, including the adoption of next-generation aircraft such as the Airbus A350 and Boeing 787. These aircraft deliver lower fuel burn and reduced emissions compared to older-generation models.
In parallel, the airline has implemented more than 80 fuel-saving initiatives, ranging from route optimisation to weight reduction measures across its operations.
Qatar Airways (QR) has also committed to broader sustainability goals, including increasing the use of sustainable aviation fuel (SAF) and aligning with the global aviation industry’s target of achieving net-zero carbon emissions by 2050.
Key Trends Across the World’s Largest Carriers
The data reveals several notable patterns among the ten largest airlines by ASK. Airlines with younger fleets and higher seat density tend to dominate the efficiency rankings.
Ryanair (FR), operating 1,148 thousand flights in 2025 with an average seat count of 191 on short-haul routes averaging 1,264 kilometres, achieved the second-lowest CO₂ per ASK at 62.7g while also reducing its intensity by 1.0% compared to 2024.
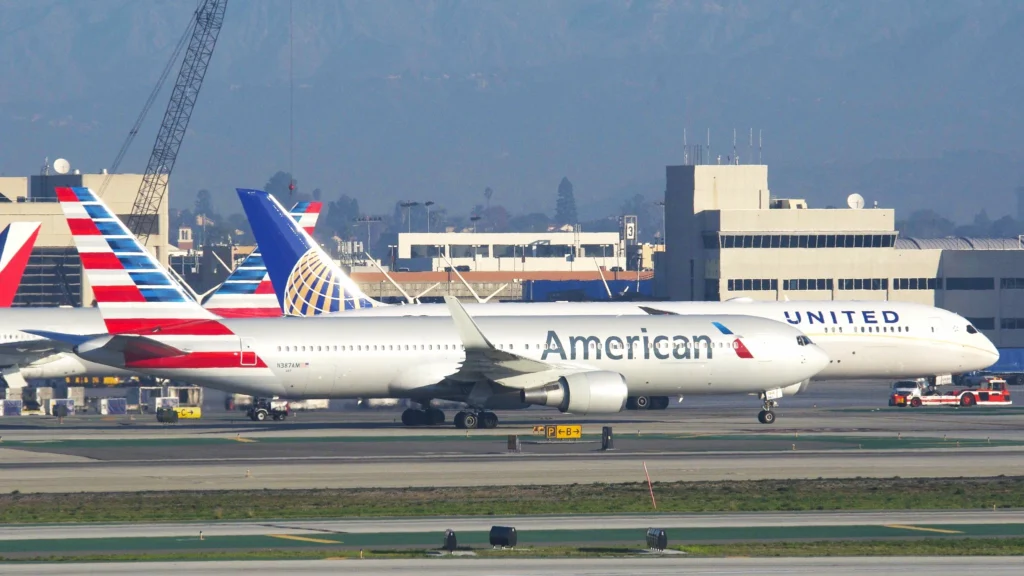
Among US carriers, Southwest Airlines (WN) leads at 67.8g per ASK, posting a 1.6% improvement year-on-year. United Airlines (UA), Delta Air Lines (DL), and American Airlines (AA) rank sixth, eighth, and ninth, respectively.
These three carriers operate older fleets averaging over 14 years and generate significantly higher total emissions, with United Airlines (UA) at 37.4 million tonnes, American Airlines (AA) at 36.2 million tonnes, and Delta Air Lines (DL) at 34.8 million tonnes.
Emirates (EK), the only other long-haul operator besides Qatar Airways (QR) in the top five, recorded 68.0g CO₂ per ASK. The Dubai (DXB)-based carrier operates the longest average flight distance at 4,902 kilometres and uses the largest average aircraft at 408 seats, but its emissions intensity rose by 1.4% compared to the previous year.
China Southern Airlines (CZ) and China Eastern Airlines (MU) showed contrasting trends. China Southern Airlines (CZ) achieved the largest year-on-year improvement at 2.3%, while China Eastern Airlines (MU) recorded the highest total emissions growth at 6.1%.
Industry Outlook on Aviation Sustainability
Industry experts note that emissions efficiency is largely driven by factors within an airline’s control, including fleet composition, seat density, and route optimisation. Airlines that invest in newer aircraft and optimise operations tend to outperform peers in sustainability rankings.
The broader trend confirms that carriers with younger fleets and high-capacity configurations will continue to lead emission efficiency tables as the industry works toward its 2050 net-zero target.
Stay tuned with us. Further, follow us on social media for the latest updates.
Join us on Telegram Group for the Latest Aviation Updates. Subsequently, follow us on Google News